I chose two projects to align my work, listening map and sound intervention. Now, my interest area is IOT and design for older adults. It seems the two categories have no connections because of the stereotype that older adults do not like new technology and avoid using it; however, technology is getting smarter and the population of older adults is increasing. There are many attempts to help their independent living with new technology. According to researchers “Between 2012 and 2050, the United States will experience considerable growth in its older population (Jennifer et al, May 2014, Current Population Reports).” “It is expected the eldest, baby boomers, will number 19 million in 2050. Elder population aged 60 years or over is expected to reach 22% in 2050 (ESA, U.S. Department of Commerce, 1995).” Therefore, many countries try to develop a system for older adults. Moreover, as far as we know, they are already familiar with technology and many of them use computers and smartphones because they are the first generation to use technology while working. According to the research data, 53% of older people in 2012 were using Internet and email and 69% of them were using mobile phone.(Ljilja, et al., 2014)
1. Sensor map (visualization)
.png)
Figure1. wirelesstag (4)
Nowadays, a sensor is used for older adults to detect their movement and to prevent fatal accidents. (Fig1) We learned how to map the sound of an area, and I made its connection to a sensor map, which can be made with time-based movements in a colored pattern. There are already sensor devices that perceive movement and send it to twitter, email, and a phone message; however, it just shows the number of usages of each sensor, there is no map of their movements. Comparing the movements of several age groups of people will provide critical cues about different life patterns based on age group behavior and create a representative age group movement map. In terms of finding their life style and behavior, mapping will be an important factor, because it is really hard to research older adults’ life style. Observing with a sensor is the easiest way to do this without bothering them.

Figure2. Flight Traffic Visualization (5)
Figure2 depicts road traffic and flight traffic. The road traffic was accumulated by movement of lines and shows the location of traffic congestion areas.
If time and frequency are presented in color vertically and horizontally, we can see their more detailed needs, patterns, and behaviors. I think the sensor map will help to understand older adults’ behavior and to help make a new device for older adults.
2. Sound intervention (research method)
Visual movement for older adults will be important in that they spend most of their time at home. If we know their daily routine by observing their movement, sound intervention should be a method to give them reminders to help them in their daily tasks, or to change their behavior. As a research method, we can conduct research on how sound intervention can change their visual pattern. Those devices that have sensors mostly provide sound functions for alerts such as reminders to take medicine or water, notifying payment dates, and checking temperature and humidity in the house.
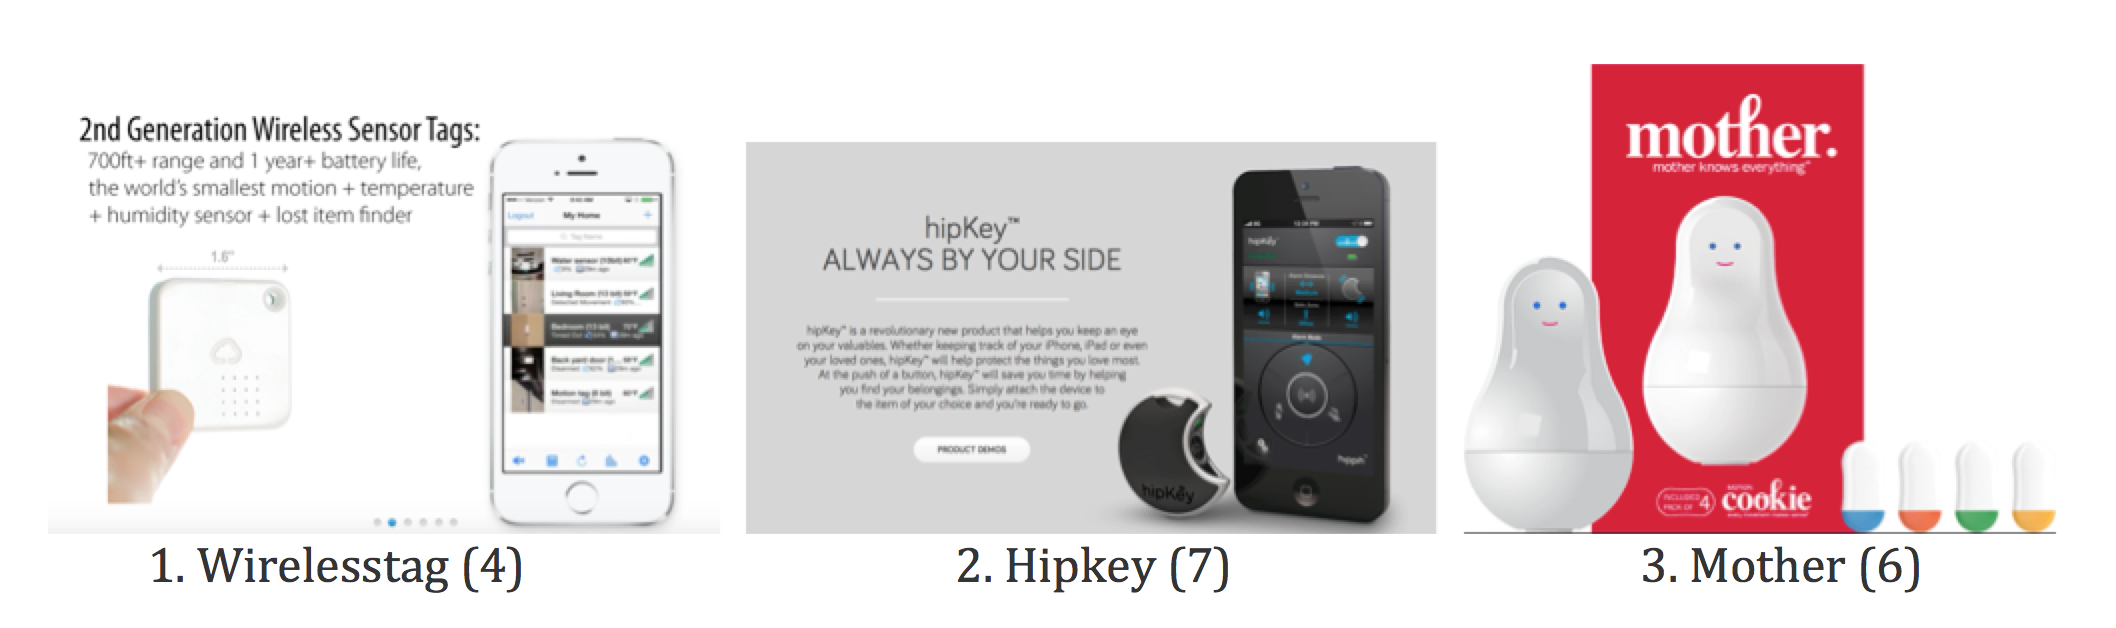
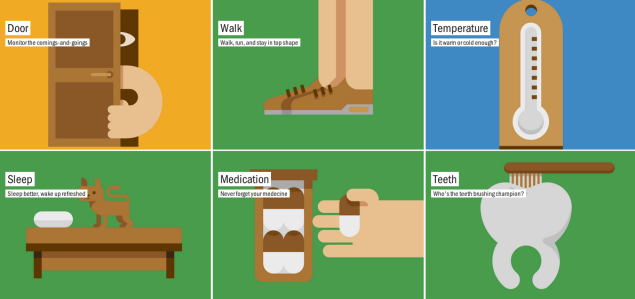
Figure4. Functions
Wirelesstag, and Mother provide notices on variations such as the movement of doors, walking pace, temperature, humidity, sleep, refrigerator usage, medication, and teeth care with small tags that are attached on a variety of surfaces.(Figure4) The data is sent to the website or phone so users can check it immediately. We can gather and make a sensor map to investigate their movement.
According to the Julian Treasure, sound affects us in 4 ways, physiological, psychological, cognitive, and behavioral. It affects most of our life. Brand sounds impacts people’s mind. One of the brand sounds, product sound help to keep a person’s behavior regularly, and help to change their behavior, affecting profit of products.
This is one of my ideas that help older adults living individually. The visual sensor map will be a conceptual understanding of their behavior. There are many ways to understand people. I think it will be a one of methods to understand them.
3. Conclusion
From the class of ArtGr698, we have learned the impact of sound when it combines with design. In the first project, I learned how to visualize sound, how it differs depending on time and situations. I did so by listening consciously and feeling that how the sound moves, what colors they have, and how the sounds changes over time. Therefore, I could make listening map. In the second project, I learned how to understand materials’ features by producing sound on it. Third project was related closely to interacting with people. I learned how to interact with people with my design and sound by providing people with intervention. Lastly, forth project was to make an individual sound space with headphone in a specific context. It was not easy, but it was valuable time spent to learn about sound as a designer. Thanks to professor Alex Braidwood for letting us know the world of sound.
Reference
- Jennifer M. Ortman, Victoria A. Velkoff, and Howard Hogan. (2014). Current Population Reports.
- Sixty-five plus in the United States. (1995). Economics and Statistics Administration, U.S. Department of Commerce.
- Ljilja Ruzic Kascak, Dr. Claudia B. Rébola, Jon A. Sanford. (2014). Integrating Universal Design (UD) Principles and Mobile Design Guidelines to Improve Design of Mobile Health Applications for Older Adults.
- http://wirelesstag.net/index.html
- https://youtu.be/s2b06qtqpp4
- https://sen.se/store/mother/
- http://www.hippih.com
- https://youtu.be/rRepnhXq33s